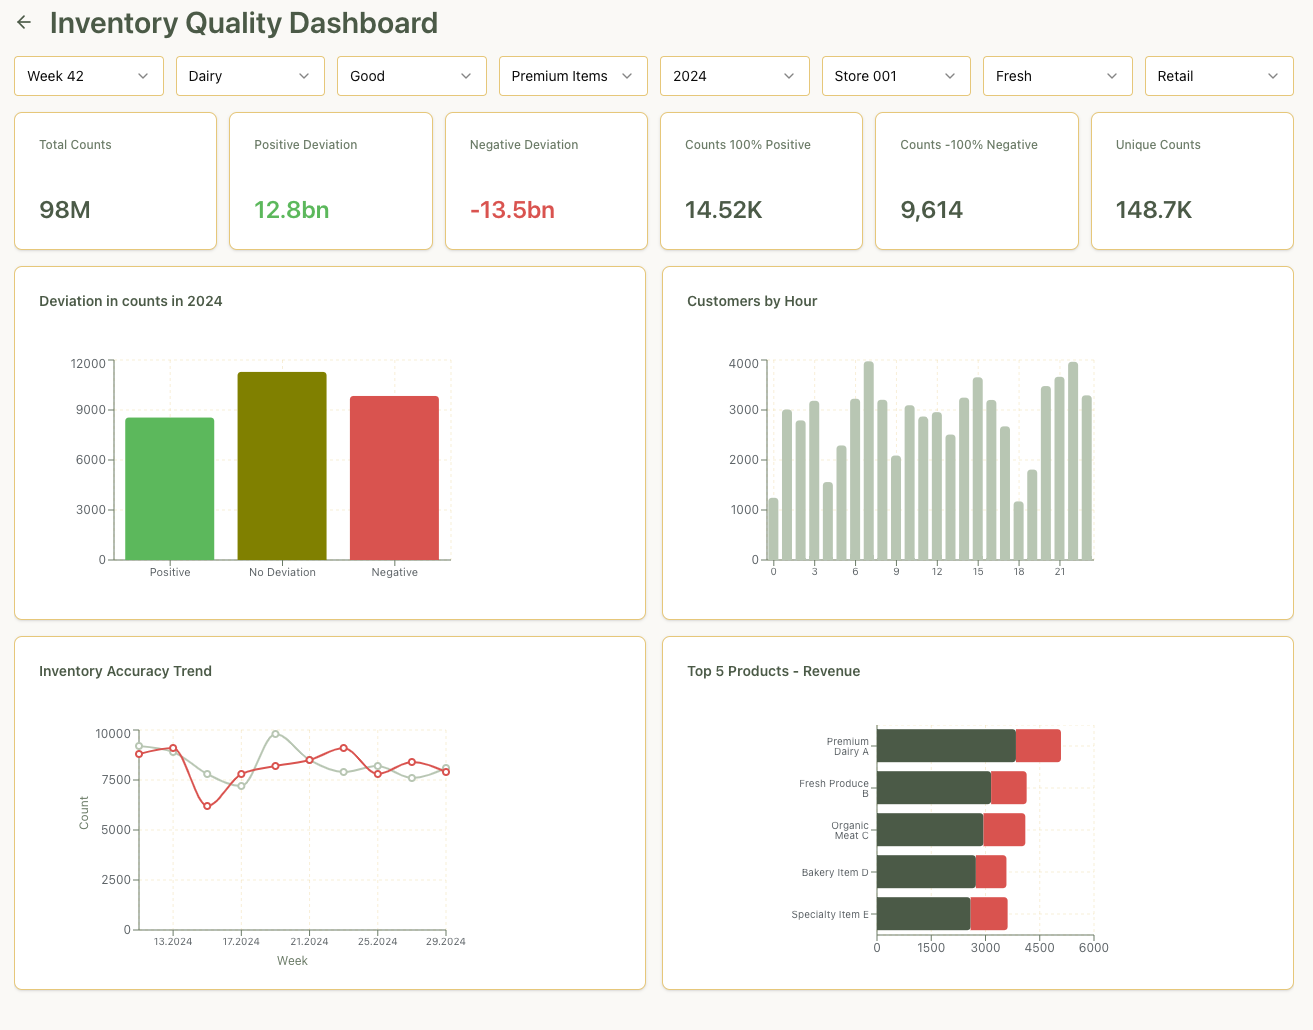
Inventory Quality Dashboard
Stock-count accuracy by store and product category: positive and negative deviations, an accuracy trend and the top products by revenue.
Sample data, built for illustration
Analytics for industry
Nereidata delivers analytics as packaged projects: reporting and dashboards, forecasting, in-depth analysis, and support through data integration and migration. Built on deep supply chain knowledge and explained in plain language.
Book a 30-minute call →02 / Services
The reports your teams open every week, in Power BI or Excel, on your real data.
From the business question to a working report: requirements, data model, dashboard and handover.
A focused study of one problem, such as inventory levels, safety stock, demand or service level.
A demand or volume forecast on your history, with accuracy shown honestly.
The business side of a system change: defining the KPIs, checking that old and new numbers match, and making sure reports keep working. Alongside your IT team or vendor.
Fixed price, agreed after a 30-minute call. Scope, timelines and outcomes depend on your data and systems.
03 / Industries
Stock-count accuracy by store and product category: positive and negative deviations, an accuracy trend and the top products by revenue.
Sample data, built for illustration
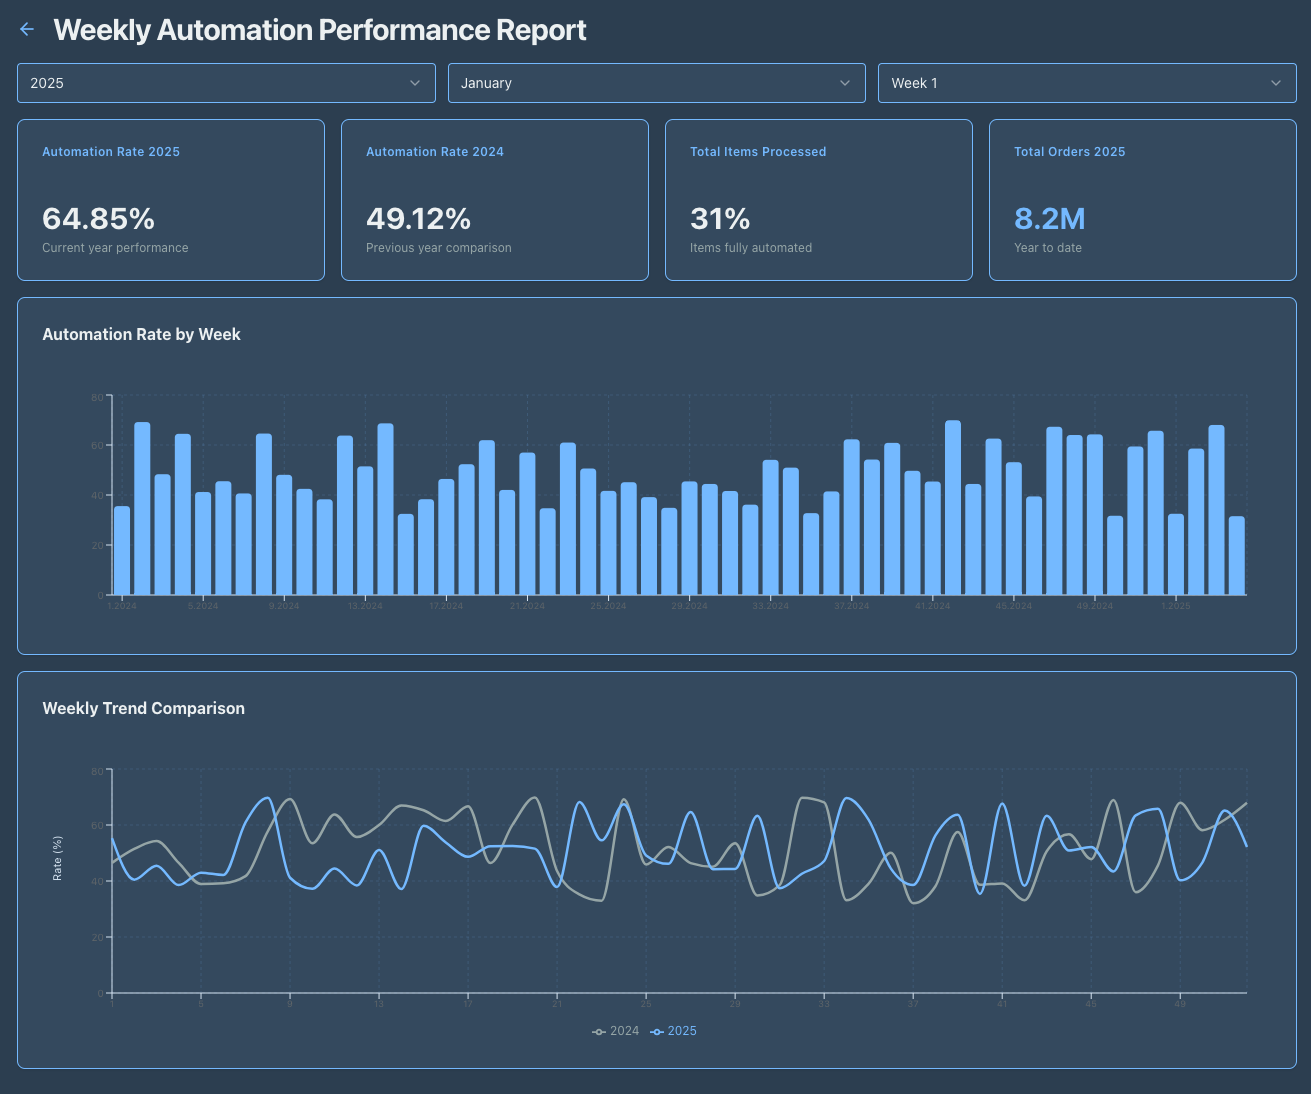
Weekly automation rate compared with the previous year, with items processed and total orders.
Sample data, built for illustration
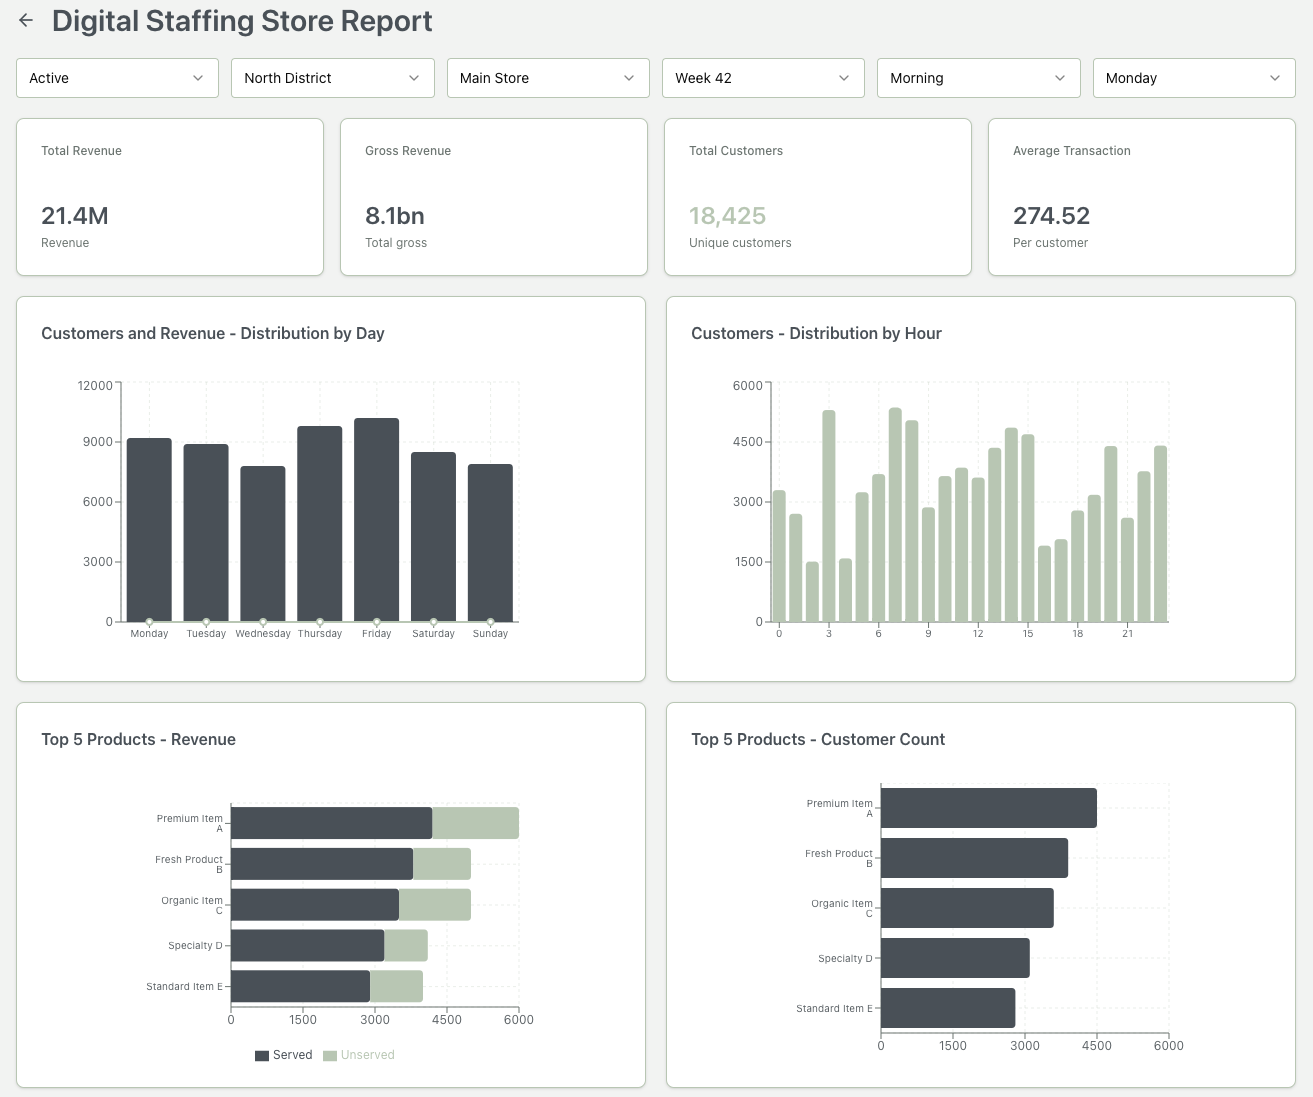
Store revenue and customer traffic by day and by hour, with top products split into served and unserved demand.
Sample data, built for illustration
Step 1
Step 2
Within two days, with fixed scope, time and price.
Step 3
If it fits, we start.
Or write to [hello@nereidata.com]